Before the Print: Using ALUR to Nowcast U.S. Labor Force Data

Before the Print: Using ALUR to Nowcast U.S. Labor Force Data
The problem: today’s labor data isn’t real-time
Every first Friday, the U.S. gets a pulse check on the labor market via government surveys. They’re essential for the public and private sectors alike to understand the state of the economy and its future path. They’re also, by design, not real-time. Collection and processing take time. So when conditions shift, financial markets and policymakers are effectively relying on stale instruments.
At WorkWhile, we operate an extensive marketplace for fractional (flexible hourly) work. Every minute, workers search for shifts, accept offers, clock in, and complete jobs. That activity is a living, breathing readout of how utilized a swath of America’s hourly workforce is right now. In this post, we show how we turn that feed into a real-time indicator, and how it helps predict a core U.S. labor-market concept: the share of workers employed last month who are still employed this month.
Our answer to real time: ALUR
Our mission at WorkWhile is simple yet powerful: help workers earn a better living by revolutionizing how workers and companies connect. The Data Science and Labor Economics team at WorkWhile supports that mission by converting marketplace telemetry into decision-ready signals – for our operations teams, for our customers and workers, and – increasingly – for U.S. macro insights.
The first of many signals derived from WorkWhile’s marketplace data is ALUR (American Labor Utilization Rate). ALUR is WorkWhile’s real-time gauge of labor attachment – a daily signal of whether experienced workers continue earning on our platform. It’s the first of its kind: a high-frequency indicator built from shift-level earnings data rather than surveys.
ALUR is constructed by considering all paid shifts on WorkWhile and then, for each worker, computing cumulative paid shifts and marking when they become a “mature” worker. For each calendar date, we form a rolling cohort of workers whose first paid shift occurred 12 months earlier within a 30-day window. Finally, among cohort members who have reached mature status by that calendar date, compute the share who continued working into the future.
WorkWhile updates ALUR hourly on our website, with data going back to January 2023.
ALUR’s parallel to a fundamental labor metric
Among critical labor force data, the closest conceptual cousin to ALUR is what we refer to here as the employment “continuation rate” – the share of workers employed in month t-1 who remain employed in month t. In the household survey, this appears in the gross flows matrix as the Employed-to-Employed transition.
Why predict the continuation rate?
The continuation rate represents the persistence of U.S. employment at any given period. In times of intense layoffs, for example, we would expect the continuation rate to decrease, as seen in the chart below. (Workers choosing to exit the labor force or quitting their jobs can also decrease the continuation rate.) Having an early, real-time read on the continuation rate is one major piece of the puzzle to understand the overall state of the labor market in real time.
Note that in the chart, as in the remaining analysis, we focus on a composite continuation rate built from three sectors—Transportation, Warehousing & Utilities (TWU, our warehousing proxy), Retail Trade, and Accommodation & Food Services (AFS) – computed as 1-(JOLTS total separations / lagged CES employment) using non-seasonally adjusted data. We selected this composite measure as these industries most closely resemble WorkWhile’s marketplace demand.

Modeling approach
Our simple objective is to validate whether ALUR has the power to contemporaneously predict the continuation rate, even when accounting for the continuation rate’s recent history. With that in mind, we adopt the approach of modeling the continuation rate in a linear regression model, predicting it based on its lagged values and contemporaneous ALUR. We leverage Newey-West (HAC) robust standard errors for assessing the significance of estimated parameters.
- Target: monthly employment continuation rate, measured by a composite of Transportation, Warehousing & Utilities; Retail Trade; and Accommodation & Food Services.
- Predictors:
- Autoregressive structure – 5 lags of the continuation rate, chosen based on the Bayesian Information Criterion.
- ALUR (contemporaneous) – our real-time utilization signal, aligned to the same month so that the month-end value of ALUR corresponds to the monthly value of the continuation rate.
- Seasonality features – a low-dimensional seasonal control via Fourier terms: we include one annual harmonic using sine and cosine with a 12-month period.
- Autoregressive structure – 5 lags of the continuation rate, chosen based on the Bayesian Information Criterion.
- Estimator: Ordinary Least Squares with Newey–West (HAC) standard errors to correct for serial correlation and heteroskedasticity.
- Estimation window: January 2023 - present.
- Evaluation: in-sample significance.
For the sake of simplicity and interpretability, we report here our analysis and findings with a linear regression model. However, we also analyzed accounting for the bounded nature of the continuation rate by using a logit transformation, and still leveraging robust standard errors. Importantly, the core conclusion is unchanged across specifications: ALUR remains a statistically and economically significant predictor of the employment continuation rate even after controlling for lags.
Results at a glance
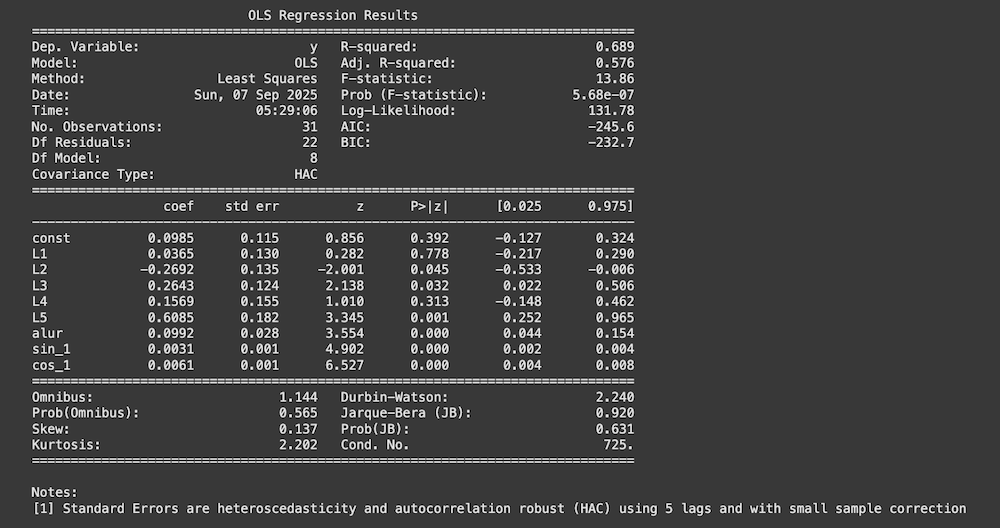
Our regression results – shared in the table below – indicate the following:
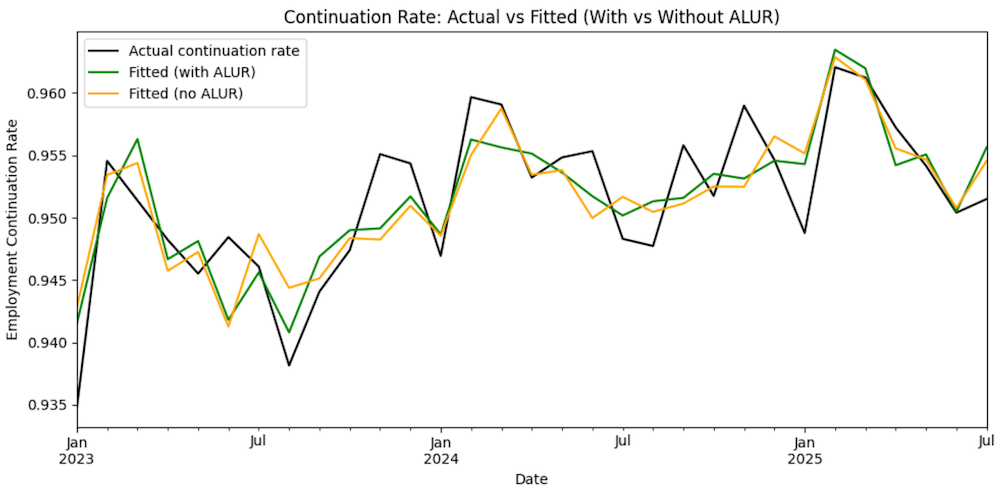
- ALUR is predictive of the continuation rate even controlling for lags. In regressions where the last 5 months of continuation are already in the model, adding ALUR improves the model’s ability to fit movements in the continuation rate (see chart), and the ALUR coefficient is statistically significant under robust errors.
- Economic significance. A 100 basis point movement in ALUR translates into an estimated 9.9 basis point change in the continuation rate.
What this means in practice
Because ALUR updates in real time and has power at predicting changes in employment dynamics, it provides a signal days to weeks before the official release. Generally speaking, for researchers, financial advisors and policymakers, ALUR offers a high-frequency read on employment persistence and labor demand, helping to:
- Nowcast payroll momentum and the continuation rate ahead of statistical agency prints, improving situational awareness between releases.
- Detect turning points—re-acceleration or cooling—early enough to inform policy timing and calibration.
- Track sectoral and regional heterogeneity (Light Industrial, Retail, Hospitality) to assess how shocks propagate across the economy.
- Reduce reliance on lagging indicators by providing a live complement to survey data and a cross-check on revision risk.
For analysts, ALUR functions as a tradable macro signal that can:
- Reduce “data-day surprise” risk by improving nowcasts of earnings and related labor metrics.
- Sharpen rate path expectations by updating views on labor tightness and near-term wage pressure.
- Inform positioning and hedging around event risk, and guide sector tilts where continuation differs across industries.
- Support scenario analysis during shocks (weather, strikes, promotions/holidays) with intramonth visibility into utilization and persistence.
What we’re building next
ALUR bridges the gap between lived labor-market conditions and official statistics—so the people steering the economy can act with greater speed and confidence. And it’s only the beginning of WorkWhile’s longer-term pursuit of driving economic innovation through real-time labor market data: Looking ahead, we plan to introduce other real-time indicators covering wage growth and demand volatility, among others. If you’d like to join us on this journey, check out our careers page or reach out to the authors on LinkedIn.

